| Legislative
Bulletin |
February
9, 2001 |
 |
January
collections run strong, but not enough to overcome the deficit
January
was the first month in a while in which the state actually
collected more tax revenues than had been ancicipated, thanks
largely to strong individual income tax collections. Through
eight months of its fiscal year, the state has collected 5
percent more in tax revenues than at this point last year, but
that's about 4 percent less than the state needs to run a
balanced budget. NCCBI is closely tracking the state's
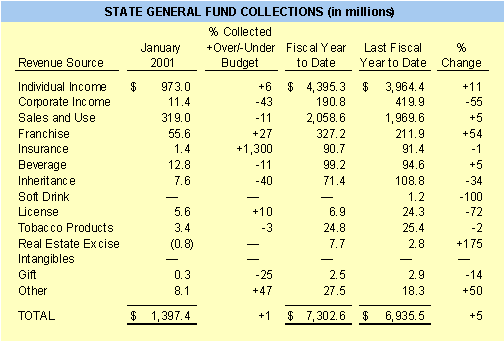
financial condition, and publishes detailed charts listing tax receipts in all categories. Immediately below is a
simplified chart that compares current month receipts to the
year-ago month. Below that chart is a more detailed,
line-by-line accounting of where things stand. All the data
was supplied to NCCBI by the State Controller's Office.

General
Fund
dollars in millions |
Current
Month |
Eight
Months Year to Date |
| Budget |
Actual |
Variance |
Budget |
Actual |
Variance |
Realized |
| Individual
Income |
$919.4 |
$973.0 |
$53.6 |
$4,523.7 |
$4,395.3 |
$(128.4) |
97.2% |
| Corporate
Income |
20.1 |
11.4 |
(8.7) |
265.8 |
190.8 |
(75.0) |
71.8% |
| Sales
and Use |
359.9 |
319.0 |
(40.9) |
2,150.2 |
2,058.6 |
(91.6) |
95.7% |
| Franchise |
43.9 |
55.6 |
11.7 |
298.6 |
327.2 |
28.6 |
109.6% |
| Insurance |
0.1 |
1.4 |
1.3 |
96.5 |
90.7 |
(5.8) |
94.0% |
| Beverage |
14.4 |
12.8 |
(1.6) |
100.5 |
99.2 |
(1.3) |
98.7% |
| Inheritance |
12.7 |
7.6 |
(5.1) |
89.2 |
71.4 |
(17.8) |
80.0% |
| Soft
Drink |
— |
— |
— |
— |
— |
— |
— |
| Privilege
License |
5.1 |
5.6 |
0.5 |
27.6 |
6.9 |
(20.7) |
25.0% |
| Tobacco
Products |
3.5 |
3.4 |
(0.1) |
24.9 |
24.8 |
(0.1) |
99.6% |
| Real
Estate |
(0.8) |
(0.8) |
— |
7.7 |
7.7 |
— |
100.0% |
| Intangibles |
— |
— |
— |
— |
— |
— |
— |
| Gift |
0.4 |
0.3 |
(0.1) |
2.7 |
2.5 |
(0.2) |
92.6% |
| White
Goods Disposal |
(0.6) |
(0.6) |
— |
0.4 |
0.4 |
— |
100.0% |
| Scrap
Tire Disposal |
(2.2) |
(2.2) |
— |
0.8 |
0.8 |
— |
100.0% |
| Freight
Car Lines |
— |
— |
— |
— |
— |
— |
— |
| Piped
Natural Gas |
8.3 |
10.8 |
2.5 |
22.5 |
26.2 |
3.7 |
116.4% |
| Other |
— |
0.1 |
0.1 |
— |
0.1 |
0.1 |
— |
| Total
Tax Revenue |
$1,384.2 |
$1,397.4 |
$13.2 |
$7,611.1 |
$7,302.6 |
$(308.5) |
95.9% |
| |
| Non-Tax
Revenue |
| Treasurer's
Investments |
17.9 |
11.0 |
(6.9) |
124.5 |
105.1 |
(19.4) |
84.4% |
| Judicial
Fees |
9.4 |
9.4 |
— |
65.3 |
61.2 |
(4.1) |
93.7% |
| Insurance |
5.8 |
5.9 |
0.1 |
24.4 |
11.7 |
(12.7) |
48.0% |
| Disproportionate
share |
— |
— |
— |
109.1 |
109.1 |
— |
100.0% |
| Highway
Fund Transfer In |
— |
— |
— |
6.8 |
6.8 |
— |
100.0% |
| Highway
Trust Fund Transfer In |
— |
— |
— |
170.0 |
170.0 |
— |
100.0% |
| Other |
9.4 |
14.3 |
4.9 |
122.6 |
111.8 |
(10.8) |
91.2% |
| Non-Tax
/ Other |
9.4 |
14.3 |
|
122.6 |
111.8 |
|
|
| Total
Non-Tax Revenue |
$42.5 |
$40.6 |
$(1.9) |
$622.7 |
$575.7 |
$(47.0) |
92.5% |
| |
| Total
All Revenue |
$1,426.7 |
$1,438.0 |
$11.3 |
$8,233.8 |
$7,878.3 |
$(355.5) |
95.7% |
|
|
|